


Life expectancy rates in the U.S. vary significantly from state to state, reflecting a range of factors including healthcare access, lifestyle choices, and socioeconomic conditions.
According to recent data, the average life expectancy in the U.S. is approximately 77.5 years, but this average masks substantial differences at the state level.
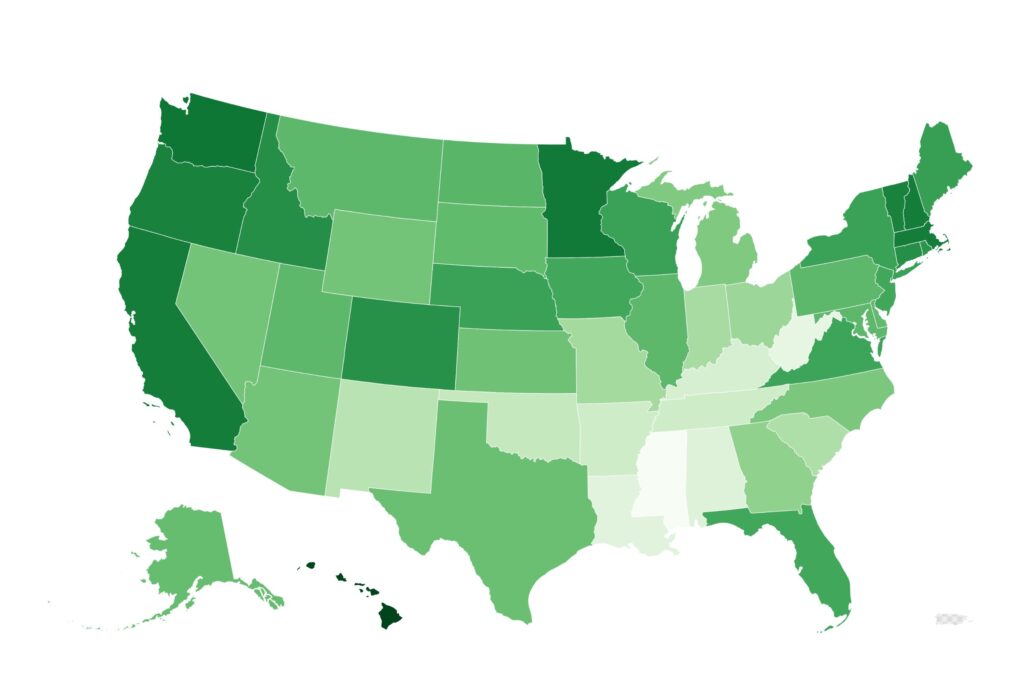
Newsweek has mapped which states live the longest, according to data from the Centers for Disease Control and Prevention (CDC).

Hawaii led the nation with the highest life expectancy at 80.7 years. The state’s residents benefit from a combination of factors, including a relatively low obesity rate of 25 percent, one of the lowest in the country.
In contrast, Mississippi had the lowest life expectancy at 71.9 years. The state faces significant public health challenges, including a high obesity rate of 39.1 percent, one of the highest in the nation.
Other states with high life expectancy rates included California and Minnesota, at 79.0 and 79.1 years respectively, and Washington at 79.2 years.
On the other hand, states like West Virginia (74.9 years), Alabama (74.9 years), and Kentucky (75.1 years) are among those with the lowest life expectancies, often due to higher rates of chronic diseases and lower healthcare quality.
The Organization for Economic Co-operation and Development (OECD) notes that life expectancy at birth is influenced by a variety of factors, including genetics, environment, and access to quality healthcare.
For instance, states with higher healthcare expenditures per capita and greater access to medical services tend to have higher life expectancy rates. Moreover, lifestyle factors such as diet, physical activity, and smoking prevalence play crucial roles in determining longevity.
Professor of medicine at Brown University, Ira Wilson, told Newsweek that there are an array of factors driving the disparities between states.
“If you look at maps of the United States that color code states for all kinds of things, what you’ll see is a surprisingly consistent story,” he said.
“[The disparity is] driven by social and economic factors, which are far beyond healthcare. They’re driven by history, by income.”
“When you add on to it low quality health and healthcare infrastructure you’ve got a double whammy,” he added.
“So when you compare the poorest state in the country […] relative to other states […] you can see correlated outcomes of various kinds.”
“If you look at smoking rates, if you look at obesity rates, if you look at childhood mortality rates, all of those things are correlated and probably driven by a combination of history and then structural, social, economic factors, and health factors,” said Wilson.
Do you have a story we should be covering? Do you have any questions about life expectancy estimates in your state? Contact LiveNews@newsweek.com
👇Follow more 👇
👉 bdphone.com
👉 ultraactivation.com
👉 trainingreferral.com
👉 shaplafood.com
👉 bangladeshi.help
👉 www.forexdhaka.com
👉 uncommunication.com
👉 ultra-sim.com
👉 forexdhaka.com
👉 ultrafxfund.com
👉 ultractivation.com
👉 bdphoneonline.com